Random walk down the Wall Street by Burton G. Malkiel
Random walk down the Wall Street is a personal finance classic. This is a fundamental book as it has been written ~40 years ago and still is relevant.
The book consists of four big parts:
- Stocks and their value: a short intro in the history of financial markets and its bubbles.
- How the pros play the biggest game in town: how good or bad the various analysis used to pick stocks work (= bad!).
- The new investment technology: more elaborate investment techniques created in the last decades.
- A practical guide for random walkers and other investors: guides, techniques and specific advice to create personalised investment portfolio.
I enjoyed the book most of the time, but sadly this, as most books about personal finance, is a book for US audience. That means that most advice about taxes and law is not apliccable to me as a European.
Some highlights:
- (The rule of 72)[#The-rule-of-72]
- “Strategies that become well known often lose their effectiveness after publication of their results.”
- It is critical that you understand yourself.
- There is no sure and easy road to riches. High returns can be achieved only through higher risk-taking (and perhaps through accepting lower liquidity)
- You get what you don’t pay for (talking about commissions)
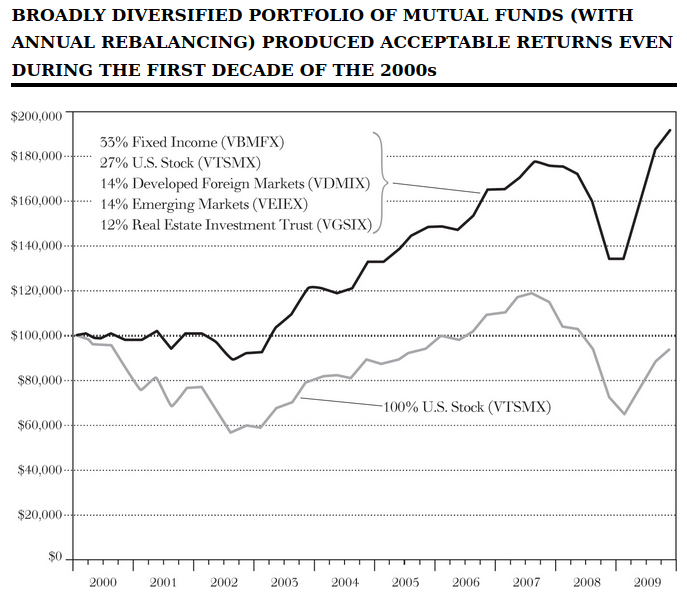
Timelss lessons involve vroad diversification, annual rebalancing, using index funds, and staying the course.
Stocks and their value
What is value and how you determine it? That’s the question we learn about in this section and go through main stock pricing theories and the history of stock market’s heights and lows.
Firm foundation theory
The firm foundation theory argues that each investment instrument, be it a common stock or a piece of real estate, has a firm anchor of something called intrinsic value, which can be determined by careful analysis of present conditions and future prospects.
Firm-foundation theory relies on some tricky forecasts of the extent and duration of future growth. The foundation of intrinsic value may thus be less dependable than is claimed.
Castle-in-the-air theory
The castle-in-the-air theory of investing concentrates on psychic values. It was a famous investors opinion that professional investors prefer to devot their energies not to estimating intrinsic values, but rather to analyzing how the crowd of investors is likely to behave in the future and how during periods of optimism they tend to build their hopes into castles in the air. The successful investor tries to beat the gun by estimating what investment situations are most susceptible to public castle-building and then buying before the crowd.
no one knows for sure what will influence future earnings’ prospects and dividend payments. … Most people are largely concerned not with making superior long-term forecasts for an investment over its whole life, but with foreseeing changes in the conventional basis of valuation a short time ahead of the general public.
/ John Maynard Keynes, got popular in 1936
October. This is one of the peculiarly dangerous months to speculate in stocks in.The others are July, January, September, April, November, May, March, June, December, August and February.
/ Mark Twain, Pudd’nhead Wilson
Madness of crowds
Since there has been a market, there have been speculative bubbles and crisis after those:
- The tulip bulb craze
- The south sea bubble
- Wall street lays an egg (1929)
In the past century since the sixties the craze has gone from private to institutional investing:
- 60’s: The growth-stock/new-issue craze (space age: if anything has a name ..tronics or something you don’t understand, you buy it)
- 60’s: The conglomerate boom (join two companies and suddenly they are growing)
- 60’s: The bubble in Concept stocks (buy “performance”)
- 70’s: The nifty fifty stocks (a bunch of big growth company stocks, just “one decision” to make)
- 80’s: The return of New Issues (microelectronics and biotechnology age: if anything has a name ..bot, you buy it)
- 90’s:Japanese yen for land and stocks (because Japan’s land and stocks in 100x more worthy than 40 years ago)
The consistent losers in the market, from my perosnal experience, are those who are unable to resist being swept up in some kind of tuli-bulb craze. It is not hard to make money in the market. What is hard to avoid is the alluring temptation to throw your money away on short, get-rich-quick speculative binges.
And of course, this millenia is even better than the previous:
- 2000: dot-com bubble
- 2008: housing bubble
- 2017: crypto bubble
Bubbles are “positive feedback loops”. A bubble starts when any groups of stocks, in this case those associated with the excitement of the internet, begin to rise. The updraft encourages more people to buy the stocks, which causes more TV and print coverage, which causes even more people to buy, which creates big profits for early internet stockholders. The successful investors tell you how easy it is to get rich, which causes the stocks to rise further, whic pulls in larger and larger groups of investors. But the whole mechanism is a kind of Ponzi scheme where more and more credulous investors must be found to buy the stock from the earlier investors. Eventually, one runs out of greater fools.
The market eventually corrects any irrationality - albeit in its own slow, inexorable fashion. Anomalies can crop up, markets can get irrationally optimistic, and often they attract unwary investors. But, eventually, true value is recognized by the market, and this is the main lesson investors must heed.
I am also persuaded by the wisdom of Benjamin Graham, author of Security Analysis, who wrote that in the final analysis the stock market is not a voting mechanism but a weighing mechanism. Valuation metrics have not changed. Eventually, every stock can only be worth the present value of its cash flow. In the final analysis true value will win out.
How the pros play the biggest game in town
As more and more people use the technique, the value deteriorates.
The alternative techniques used by the investment pros are related to the two theories of the stick market:
- Technical analysis is the method of predicting the approriate time to buy or sell a stock used by those believing in the castle-in-the-air view of stock pricing.
- Fundamental analysis is the technique of applying the tenets of the firm-foundation theory to the seecltion of individual stocks.
Technical vs fundamental analysis
Technical analysis is essentially the making and interpreting of stock charts. Many chartists believe the stock market is only 10% logical and 90% psychological.S
Fundamental analysis believe that the market is 90% logical and only 10% psychological. Fundamentalists seek to determine a stock’s proper value.
Any regularity in the stock market that can be discovered and acted upon profitably is bound to destroy itself. This is the fundamental reason why I am convinced that no one will be successful in using technical methods to get above-average returns in the stock market.
The rule of 72
The rule of 72 provides a shortcut way to determine how long it takes for money to double. Take the interest rate you earn and divide it into the number 72, and you get the number of years it will take to double your money.
For example, if the interest rate is 15 percent, it takes 72/15=4.8 years to double.
Efficient market hypothesis
There is a major battle between market professionals and academics. Efficient market hypothesis holds that the stock market is so good at adjusting to new information that no one can predict its future course in a superior manner. Prices of individual stocks quickly reflect all the news that is available.
Your guess is as good as that of the ape, your stockbroker, or even mine.
In the last decades, academics have set their eyes to stock market and test the promise of enormous profit. They have concluded that
security analysts have enormous difficulty in performing their basic function of forecasting company earnings prospects. Investors who put blind faith in such forecasts in making their investment selections are in for some rude disappiontments.
In long term, no fund or professional has ever beaten the market. If they have, it is in line with rules of chance. What is crazy, market professionals are worse than chance. You might be better off by picking random stocks than by trusting a professional.
The new investment technologies
Modern portfolio theory
Long-term studies show that on average, investors have received higher rates of return for bearing greater risk.
Portfolios of risky (volatile) stocks might be put together in such a way that the portfolio as a whole could be less risky than the individual stocks in it = DIVERSIFICATION!
The golden number = at least 50 equal-sized and well-diversified US stocks.
With such a portfolio, the total risk is reduced by over 60%. Further increases in number of holdings do not produce much additional rosk reduction.
Capital-asset pricing model
The basic logic behind the capital-asset pricing model is that there is no premium for bearing risks that can be diversified away. Thus, to get a higher average long-run rate of return, you need to increase the risk level of the portfolio that cannot be diversified away. According to this theory, savvy investors can outperform the overall market by adjusting their portfolios with a risk measure known as beta (systematic or market risk).
the capital-asset pricing model says that returns (and, therefore, risk premiums) for any stock (or portfolio) will be related to beta, the systematic risk that cannot be diversified away.
Fama-French risk factor
To add another layer, French and Fama have propsed a factor model to account for risk based on their empirical work.
- Beta: from the Captial-Asset pricing model (CAPM)
- Size: measured by total equity market capitalization
- Value: measured by the ratio of market to book value
Behavioral finance
Kahneman and Tversky have done a lot of experiments on judgement that have led to the new area of behavioral finance (see Thinking Fast and Slow).
Behavioralists believe that market prices are highly imprecise. Moreover, people deviate in systematic ways from rationality, and the irrational trades of investors tend to be correlated. Behavioral finance then takes that statement further by asserting that it is posiible to quantify or classify such irrational behavior. Basically, there are four factors that create irrational market behavior: overconfidence, biased judgments, herd mentality, and loss aversion.
Herd mentality
There is nothing so disturbing to one’s well-being and judgement as to see a friend get rich.
/ Charles Kindleberger
Loss aversion
A dollar loss ir 2 1/2 times as painful as a dollar gain is pleasurable.
/ By Kahneman and Tversky’s research
Lessons from behavioral finance
- Avoid herd behavior. Any investment that has become a topic of widespread conversation is likely to be hazardous to your wealth.
- Avoid overtrading. In Odean’s research, men tended to be more overconfident and trade far more frequently than women. His advice: If you are contemplating making a stock trade (and you are married), ask your wife whether you should do it.
- If you do trade, sell losers, not winners.
- Other stupid investor tricks:
- Be wary of new issues
- Stay cool to hot tips
- Distrust foolproof schemes
Smart beta
CAPM - capital asset pricing model
Sharpe Ratio - the higher Sharpe ratio, the higher return per unit of risk
Smart beta - some kind of strategy that bends index portfolio in some direction to acquire higher Sharpe ratio. Possible smart-beta portfolio flavors:
- “value” vs “growth”
- small vs large companies
- relatively strong stocks vs weak ones
- other: quality, profitability, low volatility, liquidity,…
Just as good cooking blends a number of food flavors, some “smart beta” portfolios mix two or more flavors together.
Implications for investors
Strategies that become well known often lose their effectiveness after publication of their results. … The core of every portfolio should consist of low-cost, tax-efficient, broad-based index funds. If you do want to take a chance that some risk factors will generate improved risk-adjusted returns in the future, you can do so most prudently if the core of your portfolio consists of capitalisation-weighted broad-based index funds. And if you do want to add additional risk factors in the pursuit of extra return, I recommend a low-expense multifactor offering rather than a fund concentrating on one risk factor.
Risk parity
Risk parity are investment techniques. They are based on a evidence-based principle that relatively safe assets often provide higher returns than are appropriate for their level of risk, while riskier assets are relatively overpriced and return less than they should. Investors can therefore improve their results by leveraging low-risk assets, buying them with some borrowed money, so as to increase their risk and return (buy in margin).
About decision making
In investing money, the amount of interest you want should depend on whether you want to eat or sleep well.
/ J Kenfield Morley, Some Things I Believe
- Gather your resources: save!
- Cover yourself with cash reserve and insurance
- Be competitive - let the yield on your cash reserve keep pace with inflation
- Learn how to dodge the tax collector: be tax efficient
- Make sure the shoe fits: understand your investment objectives
- Begin your walk at your own home: live in your own home
- Investigate a promeande throught bond country: vnvest partly in bonds (and dividend yielding stocks)
- Tiptoe through the fields of gold, collectibles, and other investments
- Remember that investment costs are not random, some are lower than others (indexes and ETFs)
- Avoid sinkholes and stumbling blocks: diversify your investment steps: understand how your vulnerable we you are to your own psychology and avoid common pitfalls.
Insurance
For most people I favor the do-it-yourself approach [to insurance]. Buy term insurance for protection and invest the difference yourself in a tax-deferred retirement plan. Such an investment plan is far superior to “whole life” or “variable life” insurance policies.
Avoid variable annuities (an investment product with an insurance feature).
Cash reserve yield - how to?
Put your koney in short term investments.
- Money market mutual funds (money funds)
- Bank certificates of deposit (CDs)
- Internet banks (putting money in a low cost safe online bank’s high yield savings account)
- Treasury bills
- Tax-exempt Money-Market Funds
Bank CDs are even safer than money funds, typically offer higher yields, and are an excellent medium for investors who can tie up their liquid funds for at least six months.
Taxes
I do suggest that you take advantage of every opportunity to make your savings tax-deductible and to let your savings and investments grow tax-free.
Gold and collectibles
Returns from gold tend to be very little correlated with the returns from paper assets. Hence, even modest holdings (say, 5% of the portfolio) can help an investor reduce the variability of the total portfolio. And if inflation were to reemerge, gold would likely produce acceptable returns. But prudence suggests - at best - a limited role for gold as a vehicle for obtaining broader diversification.
There’s nothing wrong in buying things you can love - and God knows people do have strange tastes - but my advice is to buy those things because you love them, not because you expect them to appreciate in value.
To earn money collecting, you need great originality and taste. Most people who think they are collecting profit are really collecting trouble.
Fees
Costs matter, also when buying mutual funds or ETFs. There is a strong tendency for those funds that charge the lowest fees to the investor to produce the best net returns.
There is much about investing you cannot control. You can’t do anything about the ups and downs of the stock and bond markets. But you can control your investment costs. And you can organize your investments to minimize taxes. Controlling the things you can control should play a central role in developing a sensible investment strategy.
The sleeping scale of major investments
| Sleeping point | Type of asset | 2018 expected rate of return before income tax | Length of time investment must be held to get expected rate of return | Risk level |
|---|---|---|---|---|
| Semicimatose state | Bank accounts | 0-2% | No specific investment period required. Many thrift institutions calulate interest from day of deposit to day of withdrawal. | No risk of losing what you put in. Deposits up to 20 000 (?) guaranteed by EU. An almost sure loser with high inflation, however. |
| Semicimatose state | Money-market funds | 1-2% | No specific investment period required. Most funds provide check-writing priviledges. | Very little risk because most funds are invested in government securities and bank certificates. Not usually guaranteed. Rates vary with expected inflation. |
| Semicimatose state | Certificates of Deposit (CDs) | 0.5-2.5% | Money must be left on deposit for the entire period to take advantage of a higher rate | Early withdrawals subject to penalty. Rates geared to expected inflation and will vary. |
| Semicimatose state | Treasury inflation-protected securities (TIPS) | 0.5-1% + inflation | These are long-term securities maturing in 5 years or longer. Base rates vary with maturity. | Prices can vary if sold before maturity. |
| An occasional dream or two, some possibly unpleasant | High quality corporate bonds (prime quality public utilities) | 3.5-5% | Investments must be held until maturity (5-30 years) to be assured of the stated rate. (The bonds also need to be protected against redemption.) The bonds may be sold at any time, but market prices vary with interest rates. | Very little risk if held to maturity. Moderate to substantial fluctuations can be expected in realized return if bonds are sold before maturity. Rate geared to expected long-run inflation rate. “Junk bonds” promise much higher returns but with much higher risk. |
| Some tossing and turning before you doze, and vivid dreams before awakening | Diversified portoflios of blue-chip U.S. or developed foreign sountry common stocks | 5.5-7% | No specific investment period required and stocks may be sold at any time. The average expected return assumes a fairly long investment period and can only be treated as a rough guide based on current conditions. | Moderate to substantial risk. In any one year, the actual return could in fact be negative. Diversified portfolios have at times lost 25% or more of their actual value. Contrary to some opinions, a good inlation hedge over the long run. |
| Some tossing and turning before you doze, and vivid dreams before awakening | Real estate | Similar to common stock | Same as for common stocks in general if purcase is made through REITs | Same as above but REITs are good diversifiers and can be a good inflation hedge. |
| Nightmares not uncommon but, over the long run, well rested | Diversified portfolios of relatively risky stocks of smaller growth companies | 6.5-7.5% | Same as above. The average expected return assumes a fairly long investment period and can only be treated as a rough guide based on current conditions. | Substantial risk. In any one year, the actual return could be negative. Diversified portfolios of very risky stocks have at times lost 50% or more of their value. Good inflation hedge. |
| Vivid dreams and occasional nightmares | Diversified portfolios of emerging market stocks | 8-9% | Plan to hold for at least 10 years. Projected returns impossible to quantify precisely. | Fluctuations up or down to 50% to 75% in a single year are not uncommon. |
| Bouts of insomnia | Gold | Impossible to predict | High returns could be earned in any new speculative craze as long as there are greater fools to be found. | Substantial risk. Believed to be a hedge against doomsday and hyperinflation. Can play a useful role in balancing a diversified portfolio, however. |
In addition, your psychological makeup will influence the degree of risk you should assume.
One investment adviser suggests that you consider what kind of Monopoly player you once were. Were you a plunger? Did you construct hotels on Broadwalk and Park Place? (small chances, but high pay) Or did you prefer the steadier but moderate income from the orange monopoly? The answers to these questions may give you some insight into your psychological makeup with respect to investing. It is critical that you understand yourself.
Finding your risk level, and identifying your tax bracket and income needs - seem obvious. But it is incredible how many people go astray by mismatching the types of securities they buy with their risk tolerance and their income and tax needs.
A primer in understanding and projecting returns from stocks and bonds
long run equity return = initial dividend yield + growth rate
Going through the “eras” of stock market, you get a sense of what kind of return you can expect.
| Nr | The Age of … | Years | Average annual stock return | Average annual bond return |
|---|---|---|---|---|
| Era 1 | Comfort | 1947-1968 | 14.0% | 1.8% |
| Era 2 | Angst | 1969-1981 | 5.6% | 3.8% |
| Era 3 | Exurberance | 1982-2000 | 18.3% | 13.6% |
| Era 4 | Disenchantment | 2000-2009 | -6.5% | 6.4% |
| Era 5 | Today’s markets | 2009-2018 | ~18% | ~3% |
Depending on the forecast horizon involved, as much as 40% of the variability of the future market returns can be predicted on the basis of the initial P/E (price per earnings) multiple of the market as a whole.
In general, … investors have earned higher total rates of return from the stock market when the initial P/E of the market portfolio was relatively low (~ 10), and relatively low future rates of return when stocks were purchased at high P/E multiples (~25).
Measured P/Es are often referred to as CAPEs - cyclically adjusted P/E multiples. The CAPEs are available on Robert Shiller’s website, and the earnings are calculated as average earnings over the last ten years.
A life-cycle guide to investing
- History shows that risk and return are related
- The risk of investing in common stocks and bonds depends on the length of time the investments are held. The longer an investor’s holding period, the lower the likely variation in the asset’s return.
- Dollar-cost averaging can be a useful, though controversial, technique to reduce the risk of stock and bond investment.
- Rebalancing can reduce risk and, in some circumstances, increase investment returns.
- You must distinguish between your attitude toward and your capacity for risk. The risks you can afford to take depend on your total financial situation, including the types and sources of your income exclusive of investment income.
Dollar-cost averaging will give you this bargain: Your average price per share will be lower than the average price at which you bought shares. Why? Because you’ll buy more shares at low prices and fewer at high prices.
We all wish that we had a little genie who could reliably tell us to “buy low and sell high”. Systematic rebalancing is the closest analogue we have.
Total annual returns for basic asset classes
time frame: 1926-2017
| Type | Average annual return | Year-to-year volatility of returns (Risk index) |
|---|---|---|
| Small company common stocks | 12.1% | 31.7% |
| Large company common stocks | 10.2% | 19.8% |
| Long-term government bonds | 5.5% | 9.9% |
| U.S. Treasury bills | 3.4% | 3.1% |
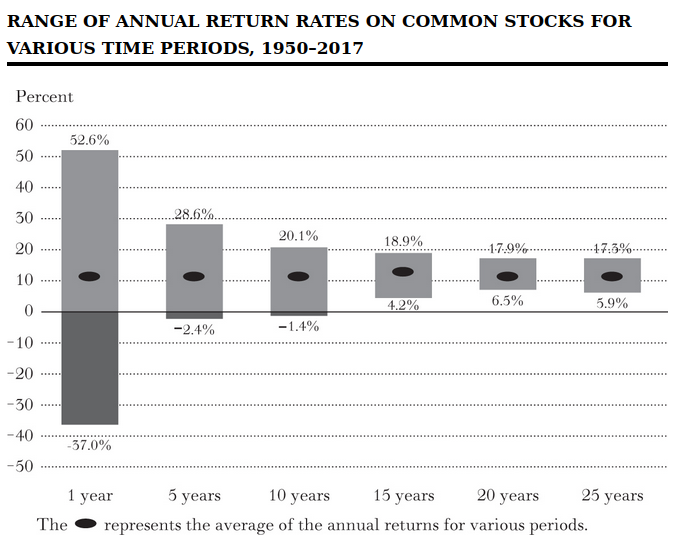
Range of annual return rates on common stocks
for various time periods (1950-2017)
The longer the time period over which you can hold on to your investments, the greater should be the share of common stocks in your portfolio.
Probability that stocks outperform bonds
% of periods since 1802 when returns of stocks exceed the return from bonds
| Investment period | % of periods when stocks have outperformed bonds |
|---|---|
| 1 year | 60.2% |
| 2 years | 64.7% |
| 5 years | 69.5% |
| 10 years | 79.7% |
| 20 years | 91.3% |
| 30 years | 99.4% |
Attitude and capacity for risk: illustrations
Mildred the 64yo widow
Mildred G. is a recently widowed sixty-four-year-old. She has been forced to give up her job as a registered nurse because of increasingly severe arthritis. Her modest house in Homewood, Illinois, is still mortgaged. Although the mortgage was taken out at a relatively low rate, it involves substantial monthly payments. Apart from monthly Social Security checks, all Mildred has to live on are the earnings on a $250,000 insurance policy of which she is the beneficiary and a $50,000 portfolio of small-growth stocks accumulated by her late husband.
It is clear that Mildred’s capacity to bear risk is severely constrained by her financial situation. She has neither the life expectancy nor the physical ability to earn income outside her portfolio. Moreover, she has substantial fixed expenditures on her mortgage. She would have no ability to recoup a loss on her portfolio. She needs a portfolio of safe investments that can generate substantial income. Bonds and high-dividend-paying stocks, as from an index fund of real estate investment trusts, are the kinds of investments that are suitable. Risky (often non-dividend-paying) stocks of small-growth companies—no matter how attractive their prices may be—do not belong in Mildred’s portfolio.
Tiffany the 26yo banker
Tiffany B. is an ambitious, single twenty-six-year-old who recently completed an MBA at Stanford’s Graduate School of Business and has entered a training program at the Bank of America. She just inherited a $50,000 legacy from her grandmother’s estate. Her goal is to build a sizable portfolio that in later years could finance the purchase of a home and be available as a retirement nest egg.
For Tiffany, one can safely recommend an aggressive portfolio. She has both the life expectancy and the earning power to maintain her standard of living in the face of any financial loss. Although her personality will determine the precise amount of risk exposure she is willing to undertake, it is clear that Tiffany’s portfolio belongs toward the far end of the risk-reward spectrum. Mildred’s portfolio of small-growth stocks would be far more appropriate for Tiffany than for a sixty-four-year-old widow who is unable to work.
Carl and Joan the loyal GM employees
Carl P., a forty-three-year-old foreman at a General Motors production plant in Pontiac, Michigan, who makes over $70,000 per year. His wife, Joan, had a $12,500 annual income from selling Avon products. The Ps had four children, ages six to fifteen. Carl and Joan wanted all the children to attend college. They realized that private colleges were probably beyond their means but hoped that an education within the excellent Michigan state university system would be feasible. Fortunately, Carl had been saving regularly through the GM payroll savings plan but had chosen the option of purchasing GM stock under the plan. He had accumulated GM stock worth $219,000. He had no other assets but did have substantial equity in a modest house with only a small mortgage remaining to be paid off.
I suggested that Carl and Joan had a highly problematic portfolio. Both their income and their investments were tied up in GM. A negative development that caused a sharp loss in GM’s common stock could ruin both the value of the portfolio and Carl’s livelihood. Indeed, the story ended badly. General Motors declared bankruptcy in 2009. Carl lost his job as well as his investment portfolio. And this is not an isolated example. Remember the sad lesson learned by many Enron employees who lost not only their jobs but all their savings in Enron stock when the company went under. Never take on the same risks in your portfolio that attach to your major source of income.
Names and details
- Specific needs require dedicated specific assets
- recognize your tolerance for risk
- persistent saving in regular amounts, no matter how small, pays off
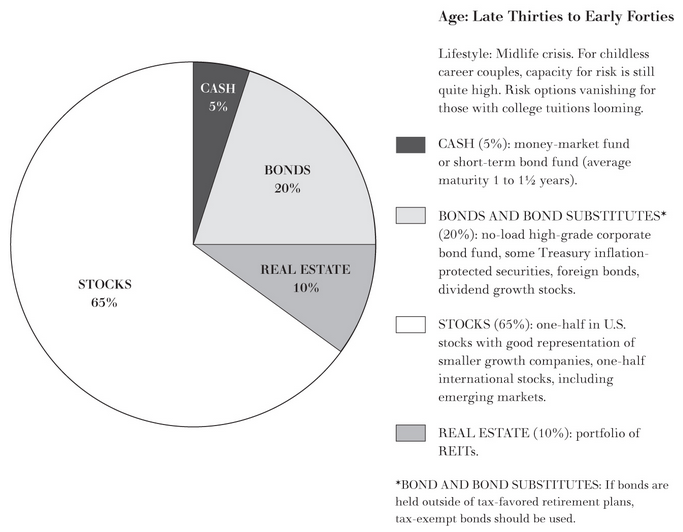
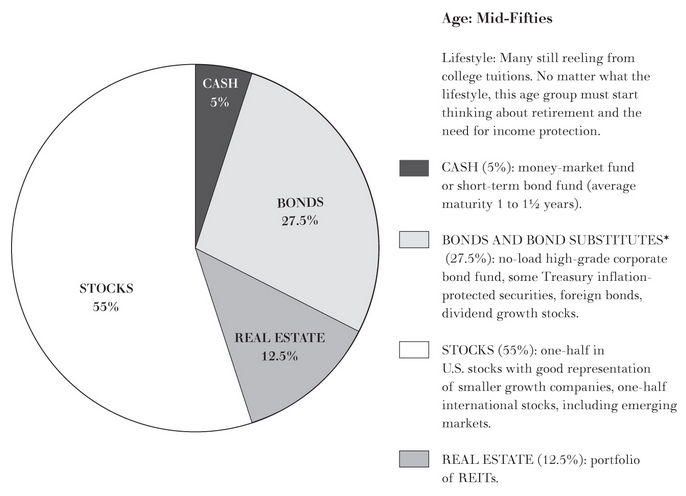
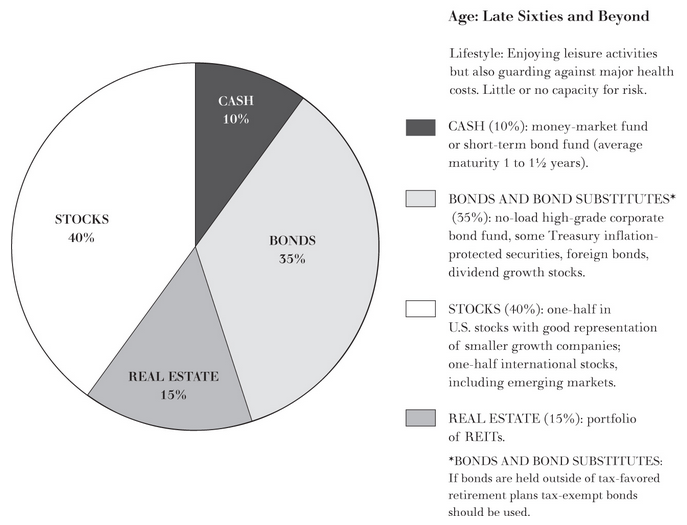
In general, the proportion of bonds in one’s portfolio should equal one’s age.
Suggested split of your available amount of money depending on your age bracket: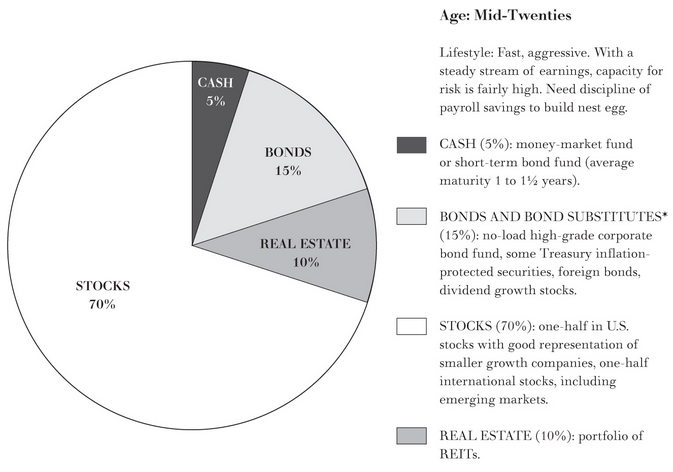
4% solution
Under the 4% solution you should spend no more than 4% of the total value of your nest egg annually. At that rate the odds are good that you will not run out of money even if you live to a hundred. It is noghly likely, too, that you will also be able to leave your heirs with a sum of money that has the same purchasing power as the total of your retirement nest egg. Under the 4% rule, you would need $450 000 of savings to produce an income in retirement of $1500 per month or $18000 per year.
Why 4%?
- it is highly likely that your annual growth will be around 6%, so you leave the 2% for inflation
- you should have some extra for bear markets
Index funds
The index fund is a sensible, serviceable method for obtaining the market’s rate of return with absolutely no effort and minimal expense.
I believe that if an investor is to buy only one US index fund, the best general US index to emulate is one of the broader indexes such as the Russell 3000, the Wilshire Total Market Index, the CRSP Index, or the MSCU US Broad Market Index - not the S&P 500.
Total stock market index funds (thatinclude more than S&P500 companies) have consistently provided higher returns than average equity mutual-fund manager.
Index funds currently exist that mimic the performance of various international indexes such as the Morgan Stanley Capital International (MSCI) index of European, Australasian, and Far Eastern (EAFE) securities, and the MSCI emerging-markets index. In addition, there are index funds holding real estate investment trusts (REITs) as well as corporate and government bonds.
I suggest that a substantial part of every portfolio be invested in emerging markets.
ETFs and taxes
Utilizing a sample of 62 mutual funds with long-term records, Stanford University economists found that, pre-tax, $1 invested in 1962 would have grown to $21.89 in 1992. After paying taxes on income dividends and capital gains distributions, however, that same $1 invested in mutual funds by a high-income investor would have grown to only $9.87
To a considerable extent, index mutual funds help solve the tax problem. Because they do not trade from security to security, they tend to avoid capital gains taxes. Nevertheless, even index funds can realize some capital gains that are taxable to the holders. These gains generally arise involuntarily, either because of a buyout of one of the companies in the index, or because sales are forced on the mutual fund. The latter occurs when mutual-fund shareholders decide on balance to redeem their shares and the fund must sell securities to raise cash. Thus, even regular index funds are not a perfect solution for the problem of minimizing tax liabilities.
Exchange-traded index funds (ETFs) such as “spiders” (an S&P 500 Fund) and “vipers” (a total stock market fund) can be more tax-efficient than regular index funds because they are able to make “in-kind” redemptions. In-kind redemptions proceed by delivering low-cost shares against redemption requests. This is not a taxable transaction for the fund, so there is no realization of gain that must be distributed. Moreover, the redeeming ETF shareholder pays taxes based on his or her original cost of the shares—not the fund’s basis in the basket of stocks that is delivered.
No-load index mutual funds will better serve investors who will be accumulating index shares over time in small amounts.
List of potential ETFs where to start (from US investor’s perspective)
| ETF | Ticker | Expense ratio |
|---|---|---|
| Total US stock market | ||
| Vanguard Total Stock Market | VTI | 0.04% |
| SPDR Total Stock Market | SPTM | 0.03% |
| Developed Markets (EAFE) | ||
| Vanguard Europe Pacific | VEA | 0.07% |
| iShares Core MSCI Intl Developed Markets | IDEV | 0.07% |
| SPDR Developed World ex-US | SPDW | 0.04% |
| Emerging Markets | ||
| Vanguard Emerging Markets | VWO | 0.14% |
| SPDR Emerging Markets | SPEM | 0.11% |
| iShares Core MSCI Emerging Markets | IEMG | 0.14% |
| Total World ex-US | ||
| Vanguard FTSE All World ex-US | VEU | 0.11% |
| SPDR MSCI ACWI ex-US | CWI | 0.30% |
| iShares Core MSCI Total International Stock | IXUS | 0.11% |
| Total World Including US | ||
| Vanguard Total World | VT | 0.10% |
| iShares MSCI ACWI | ACWI | 0.32% |
| Bonds Market US | ||
| Vanguard Total Corporate Bond Fund | VTC | 0.07% |
| iShares investment Grade Corporate Bond | LQD | 0.15% |
| Schwab US Aggregate Bond | SCHZ | 0.04% |
DIY stock picking rules (if you really want to)
I sell before the end of each calendar year any stocks on which I have a loss. The reason for this timing is that losses are deductible (up to certain amounts) for tax purposes, or can offset gains you may already have taken. Thus, taking losses can lower your tax bill. I might hold a losing position if the growth I expect begins to materialize and I am convinced that my stock will eventually work out.
- Confine stock purchases to companies that appear able to sustain above-average earnings growth for at least 5 years
- Never pay more for a stock than can reasonably be justified by a firm foundation of value
- It helps to buy stocks with the kinds of stories of anticipated growth on which investors can build castles in the air
- Trade as little as possible